
In the consulting world, transforming complex data into clear, actionable insights is critical for effective decision-making. Data visualization helps bridge the gap between raw numbers and strategic decisions, making it easier for clients to grasp key trends and patterns quickly. Instead of getting lost in a sea of figures, clients can engage with data that’s visually organized and designed to highlight the most important information.
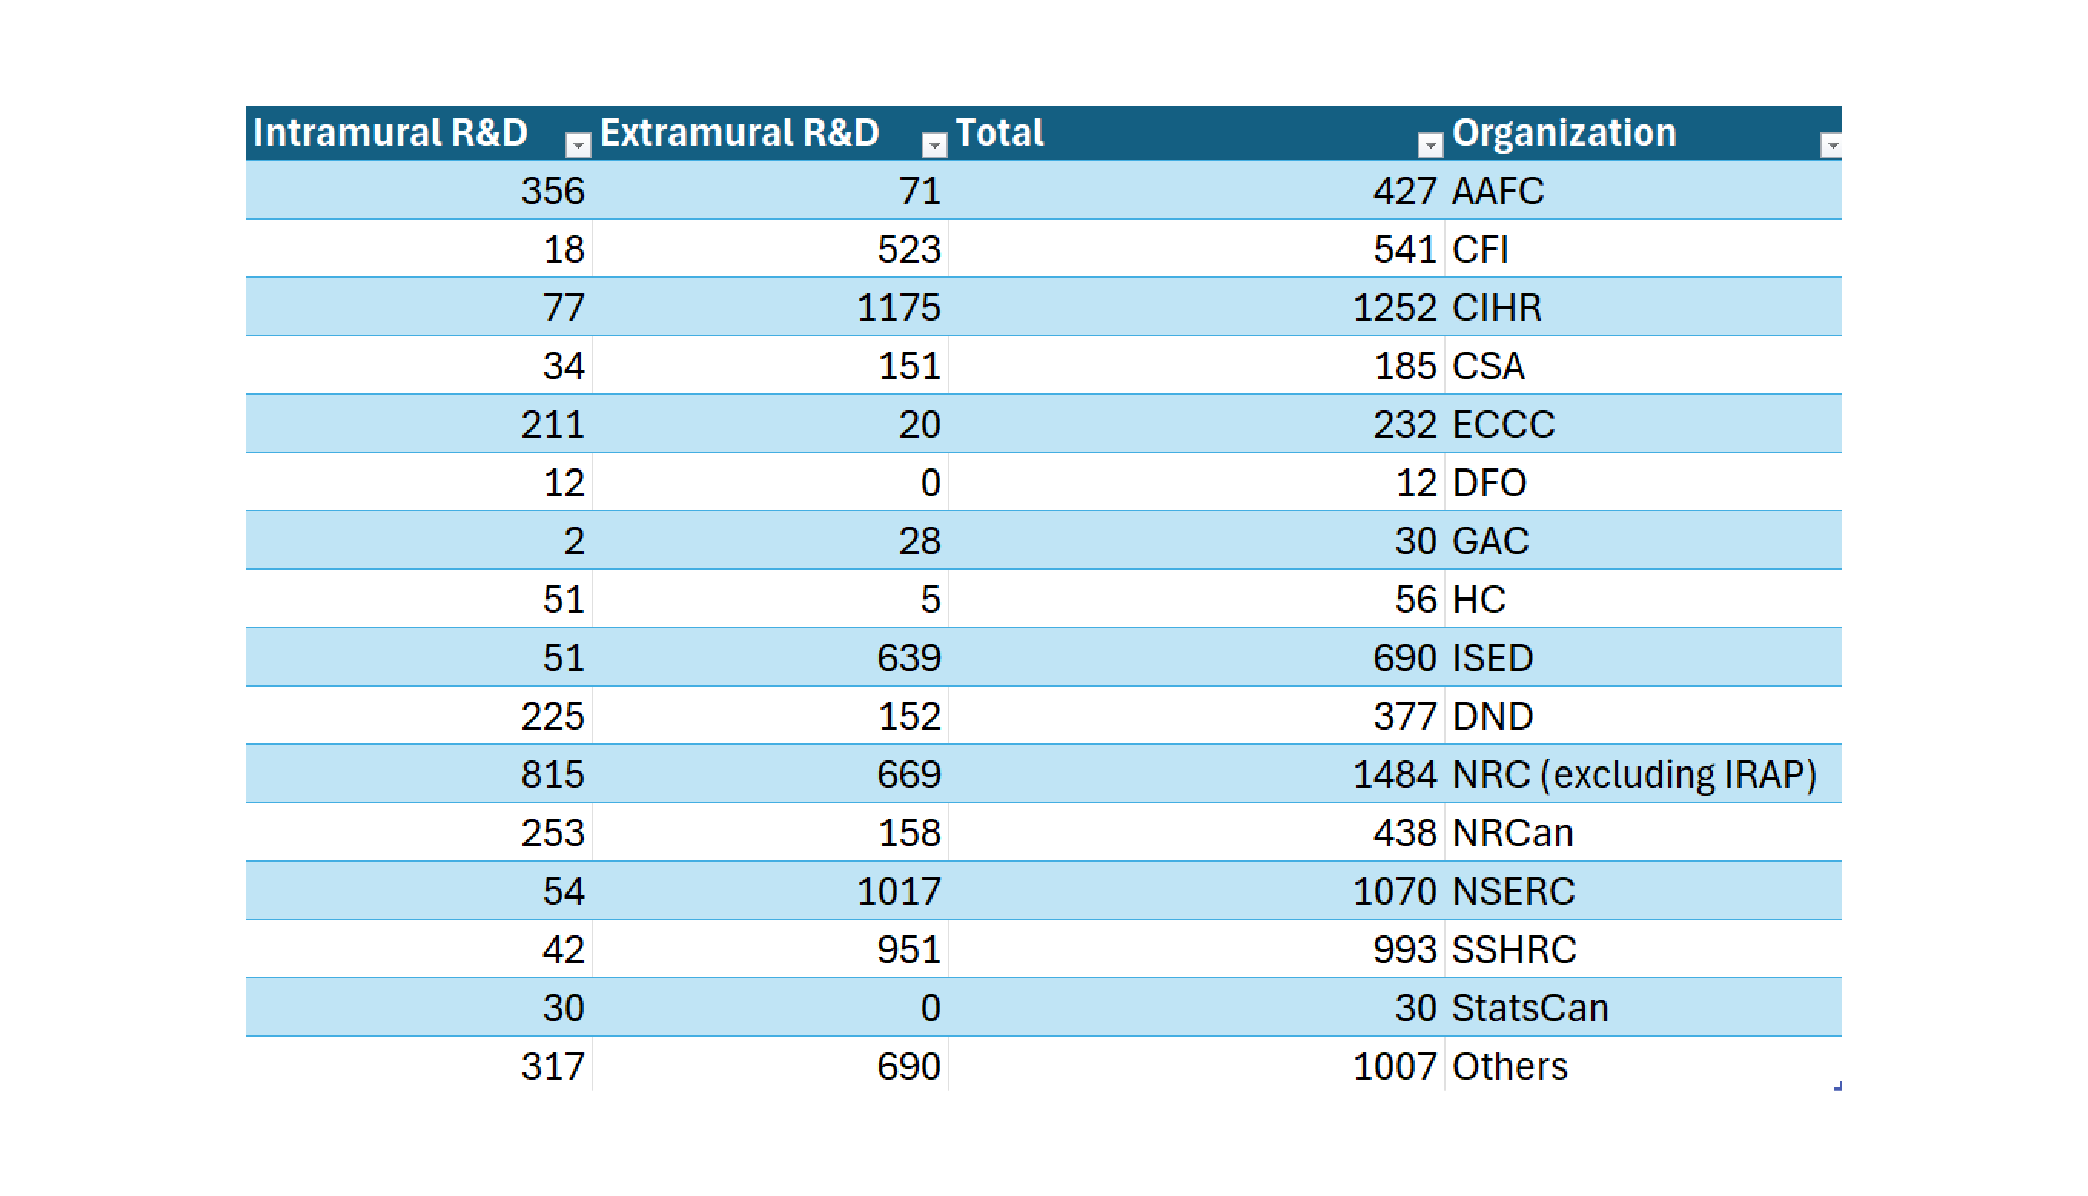

Visualization tools help convey the relationships between various elements in a project or business ecosystem. Rather than presenting static reports, consultants can use dynamic visuals to help clients navigate complex data. This makes it possible for them to spot connections, understand how different factors interact, and identify opportunities or risks at a glance.
The power of visualization lies in its ability to simplify complexity. Raw data can be overwhelming, especially when multiple factors are at play. By translating this data into visual formats, clients can easily identify patterns, see how different factors influence one another, and understand their broader implications. This enhances clarity and empowers clients to make better-informed decisions without getting bogged down in details.
Engagement is another crucial benefit of data visualization. By using interactive charts or graphs, clients are invited to explore data in a way that static reports simply can’t provide. This makes the consulting process more collaborative, allowing clients to better understand the insights being shared and take an active role in discussions. With visuals, clients not only see the data but can interact with it, leading to a deeper understanding and more productive conversations.
In a fast-paced business environment, clients expect more than just raw data—they want actionable insights that help drive results. Visualization provides a competitive edge by allowing firms to present data in an engaging and easily digestible format. When clients can quickly see the full picture and make informed decisions based on clear insights, they are more likely to act on the recommendations being made.
Ecosystem Explorer is a powerful tool that enhances this process by helping clients visualize and explore complex business ecosystems. By offering interactive, customizable maps, the platform allows clients to see how different sectors, stakeholders, and trends are interconnected. This tool enables users to navigate their data in real time, making it easier to adapt strategies and respond to changes as they happen.
Data visualization is not just about presenting information—it’s about making that information work for the client. By turning complex data into clear, actionable visuals, consulting firms can help clients navigate challenges and make informed, confident decisions. Tools like Ecosystem Explorer make it easier for clients to understand their business environment, paving the way for smarter decisions and better outcomes.